
We can’t help but ask ourselves, for example, the maximum amount that we’d pay for a ticket before we look up the price. Why do we not do this with data ie decide what our decision will be once we find the data rather than looking at the data and deciding what our decision will. If the null hypothesis is confirmed then we do this, if not we do that.
– Wise but unremembered dude from the internet
Through the years I have enjoyed and then largely forgotten lots of statistics courses. An excellent Lean Six Sigma course I did recently at the Lean Enabled Group did much to remind me. I have reproduced their ‘Hypothesis test selection road map’ to help cement some of the most common tests in my brain. There is further explanation underneath.
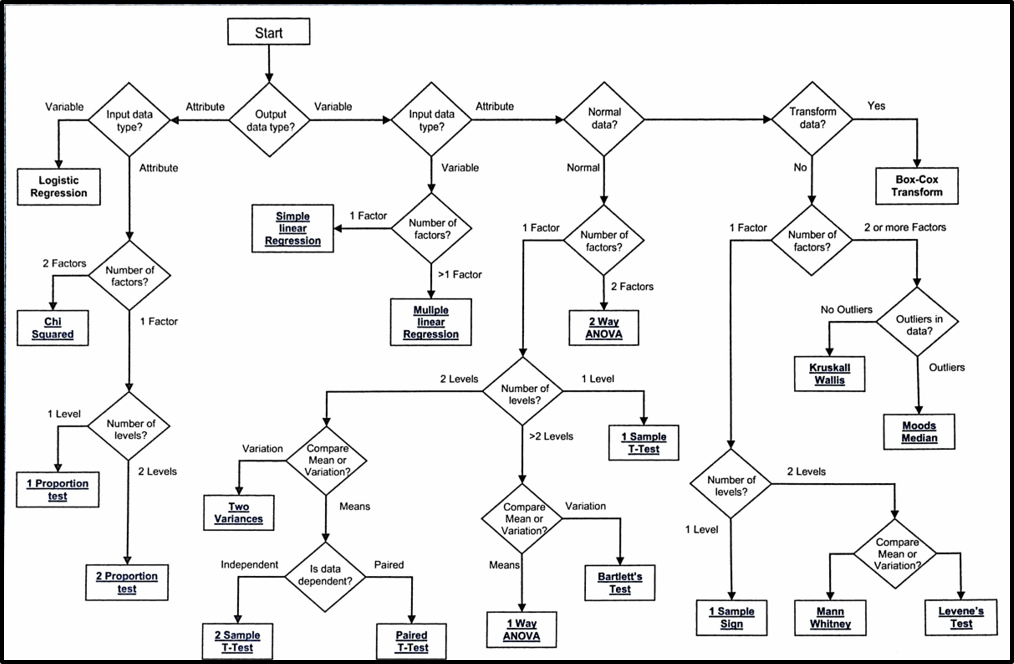
We start with our our Y (output) which is a function of our Xs (inputs). Once you have defined them you can select the appropriate test for your hypothesis and remember if the p is low then the null must go (> 0.05)
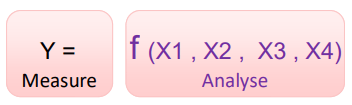
Each can be a different type of data:
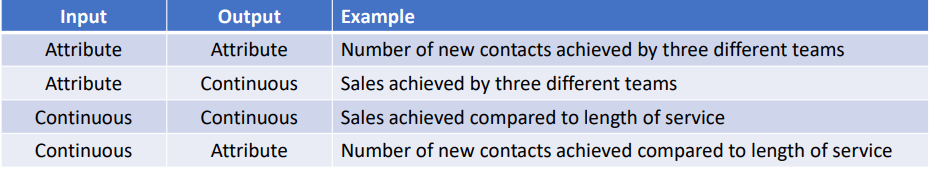
Data can be an Attribute (also referred to as discrete) or Continuous (also referred to as variable).
Within the data there are Factors: X’s that can influence the output Y’s and Levels: Number of different values of a factor
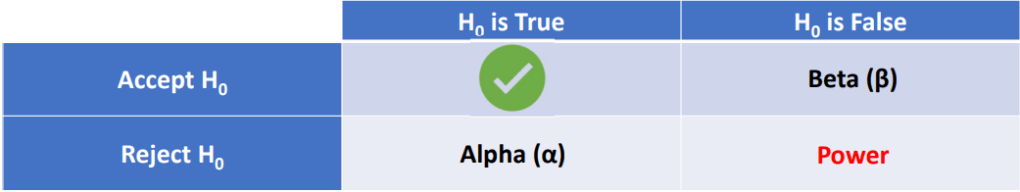
Type I and Type II Errors in Hypothesis testing
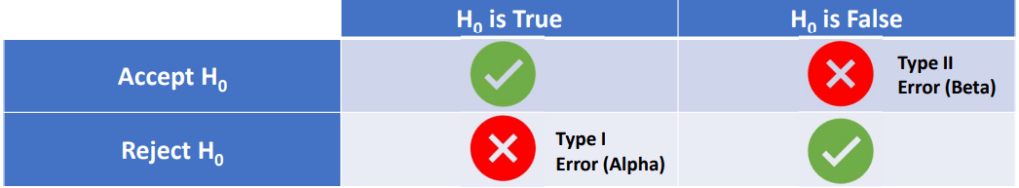
Type I error or Alpha Error (False Positive): We reject the null hypothesis when it’s true.
Example 1 Legal process: null is the person is innocent and the error is we incorrectly imprison an innocent person.
Example 2 Drug Trials: null is the drug is ineffective and the error is we release a drug that is ineffective.
Type II error or Beta Error (False Negative):
We accept the null when it’s actually false.
Example 1 Legal Process: null is the person is innocent and we incorrectly free a guilty person.
Example 2 Drug Trials: null is the drug is ineffective and the error is we don’t release a drug that is actually effective.
Sometimes errors can occur because the sample is too small, Power analysis can help with selecting an appropriate sample size however we do not always have the information we need. Power is the probability of rejecting the null hypothesis correctly
Common assumptions for hypothesis tests
Checking for the normal distribution
Most of these tests work best if the data is normally distributed. The null hypothesis of an Anderson Darling is that a data set has a particular distribution eg if the p value is greater than 0.05 then the distribution is normal – can be used for other distributions too and there are other tests for normality but I like this better than looking at scatter plots (although I like that too).
Checking for homogeneity of variances
- Levene’s Test: A commonly used test that is relatively robust to departures from normality. It tests the null hypothesis that the variances are equal across groups.
- Bartlett’s Test: Another test for equal variances, but it is more sensitive to departures from normality than Levene’s test.
- F-test: Primarily used for comparing the variances of two groups. It is sensitive to the normality assumption.
Independence of variables
- Chi squared test for attribute data
- Correlation Coefficients for continuous data Pearson or Spearman
