
Reports ready by 7am: applying DMAIC to overnight processing
Why were the patient tracking list reports so often late, and could they be ready on time every morning? I used Lean Six Sigma’s DMAIC method to find out. The overnight run got 91 minutes faster on average, and much more predictable.
| Role | Improvement lead and data analyst, coaching the development team’s senior managers |
| Setting | Overnight data warehouse processing that feeds the patient tracking list (PTL) reports |
| Methods | DMAIC, Y = f(x), time series and Pareto charts, 5 Whys, PDSA cycles, two-sample t-test |
| Data sources | Database run logs, checked against Windows Event Viewer times |
| Outputs | Rewritten code for the slowest components, code templates and automated testing |
At a glance
I compared 28 overnight runs from before the changes with 28 runs from after them.
−32% mean run time (286 → 195 minutes) |
−84% run-to-run variation (standard deviation 240 → 39 minutes) |
p = 0.029 a statistically significant improvement |
The challenge
The voice of the customer was clear: PTL reports weren’t available when people needed them. Operational teams use these reports to manage waiting lists, so a late report holds up the start of the working day.
Each night’s run processes about 2,000 data model components (DMCs). Nobody could say which of them were causing the delays, or whether things were getting better or worse.
What I did
I followed the five DMAIC phases and coached the development team’s senior managers to plan, analyse and interpret the data at each stage.
-
Define. I translated the customer’s complaint into a measurable critical-to-quality (CTQ) requirement: 100% of overnight processing completed by 7am, every day.
-
Measure. I framed the problem as Y = f(x). Y is the overnight processing time and the Xs are the run times of the 2,000 DMCs. I built a data collection plan (below) and plotted Y on a time series chart.
-
Analyse. A Pareto chart of the DMC run times showed which components took the longest. A 5 Whys analysis traced the root cause to wide variation in the quality of the code behind each DMC.
-
Improve. The team used PDSA cycles to rewrite the code of the worst-performing components, testing each change before moving on to the next.
-
Control. A before-and-after two-sample t-test confirmed the changes had worked. To hold the gains, we turned the lessons from the rewrites into code templates for developers and added automated testing to support peer review.
Measurement plan
| Y (output) | Overnight processing times |
| Xs (inputs) | How long each data model component takes |
| Ensuring consistency | Validate database log times against Windows Event Viewer times |
| Analysis | Time series plot to show long-term and short-term variation from the mean One-tailed two-sample t-test to compare mean overnight processing times before and after the improvements |
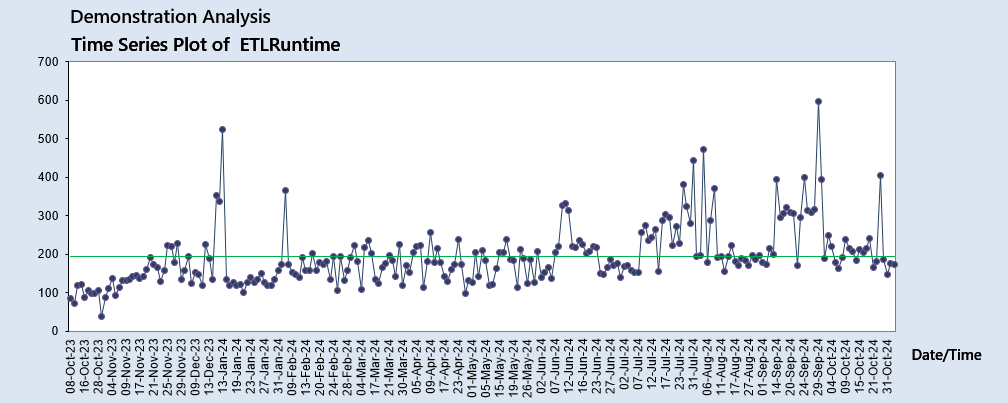
Figure 1: Time series of overnight run times. Before any changes, run times were trending upwards, with frequent short-term spikes.
I used this chart to show senior managers two things. First, run times were creeping up over the long term. Second, frequent short-term spikes were what made the reports late on bad nights.
Key findings
-
The run got faster. Mean processing time fell from 286 to 195 minutes, saving about an hour and a half every night.
-
The run became predictable. The standard deviation fell from 240 to 39 minutes. For the people waiting on the reports, this reliability matters as much as the speed.
-
The improvement is real. A one-tailed two-sample t-test (unequal variances) gave p = 0.029, below the 0.05 significance level, so the improvement is unlikely to be chance.
-
The root cause was inconsistent code. The longest-running components shared one root cause: variable code quality. Targeting the worst of them first gave the biggest return for the effort.
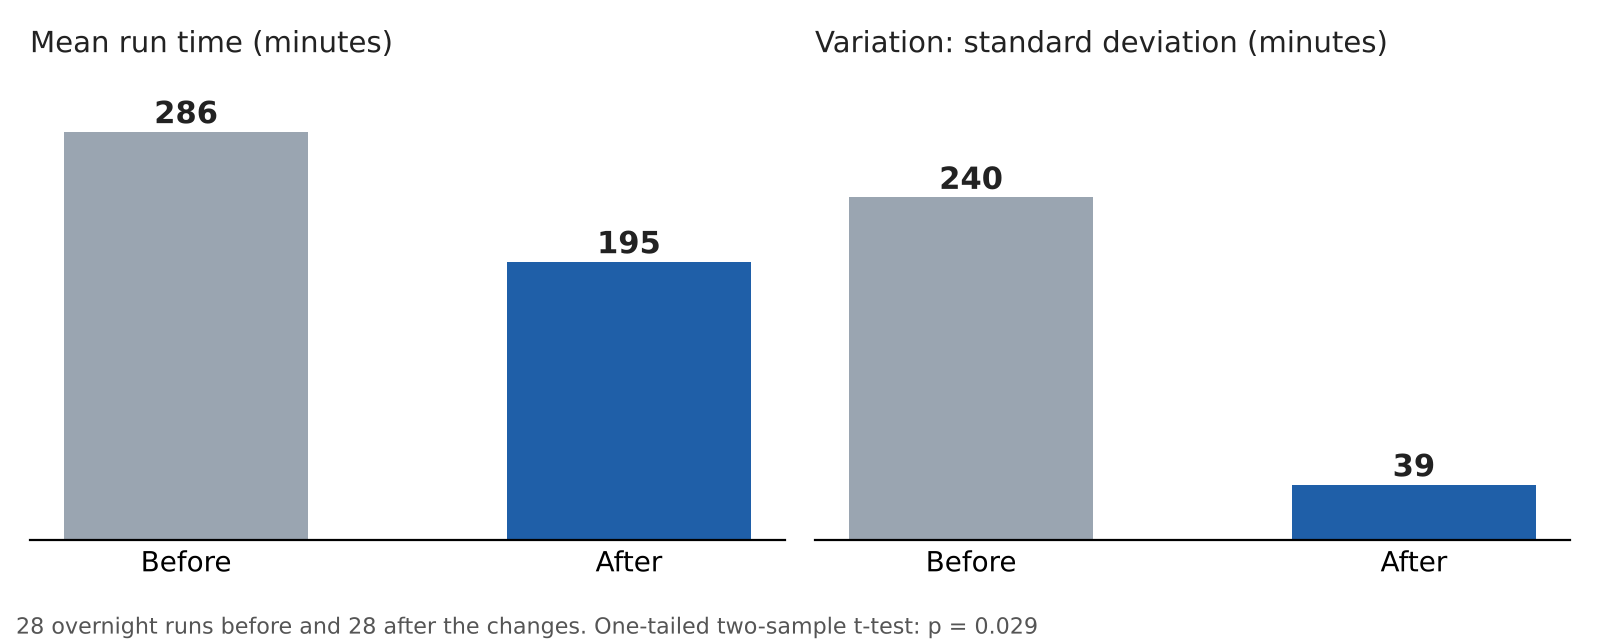
Figure 2: Mean run time and variation before and after the improvements.
Sustaining the gains
Faster code fixes the problem today, but new code can bring it back. So we built the lessons into the way the team works:
-
Code templates based on the PDSA rewrites, so new components start from proven patterns
-
Automated testing to support peer review, catching slow or inconsistent code before it reaches the overnight run
Skills demonstrated
Lean Six Sigma (DMAIC), translating the voice of the customer into a CTQ, measurement system planning, time series and Pareto analysis, root cause analysis, PDSA, hypothesis testing, and coaching senior managers in data-driven decision making.
Figures are aggregate run-time statistics only. No patient-level data is included.