
Thrive after Epic go live
Does training clinicians to personalise Epic actually work? The Thrive programme across two NHS trusts and found the evidence: +17% efficiency, +20% proficiency and happier clinicians in the pilot.
Thrive: measuring the impact of Epic personalisation training
Data Lead · Apollo Thrive pilot programme · GSTT & King’s College Hospital · 2023–24
| Role | Data Lead (Data Analyst Trainer), Apollo Thrive pilot programme |
| Organisations | Guy’s and St Thomas’ and King’s College Hospital NHS Foundation Trusts |
| Data | Epic Signal, NEAT, USAL, Google Forms survey data |
| Output | Evaluation of pilots and data recommendations in the programme proposal (SBAR) |
At a glance
In the Cardiology pilot (13 clinicians, six one-hour sessions), my before-and-after analysis showed:
+17% efficiency (Signal PEP score) |
+20% proficiency (Signal score) |
+12% user happiness (survey) |
Cardiology moved from below the department benchmark on efficiency to close to it, and from just above benchmark on proficiency to well above it.
The challenge
Thrive ran six pilots across both trusts (Cardiology, ENT, Dermatology, Fracture Clinic, Maternity Assessment Unit and Community). The board needed evidence before committing resource to a business-as-usual service, but the data was scattered: each Epic source covered a different staff group, refreshed on a different cycle, and some arrived only on ad hoc request up to two months after the period ended.
What I did
-
Mapped the data landscape. Assessed four sources (Signal, NEAT, USAL and survey data) for what each measures, which staff groups it covers and how quickly it becomes available, and documented the gaps.
-
Designed the evaluation. Defined matched pre- and post-training periods for each pilot cohort and compared results against a department-wide benchmark so improvements could be read in context.
-
Built the pre/post survey. Created a Google Forms survey to capture Epic happiness (1–10), features users struggled with, and free-text feedback, giving near real-time insight alongside the slower Epic data.
-
Analysed and visualised results. Calculated changes in Signal efficiency (PEP) and proficiency scores, tracked USAL personalisation levels, and segmented survey responses, for example linking Dragon voice-recognition use to higher happiness.
-
Shaped the recommendations. Wrote the data sections of the programme proposal (SBAR) presented to the Thrive Task and Finish group.
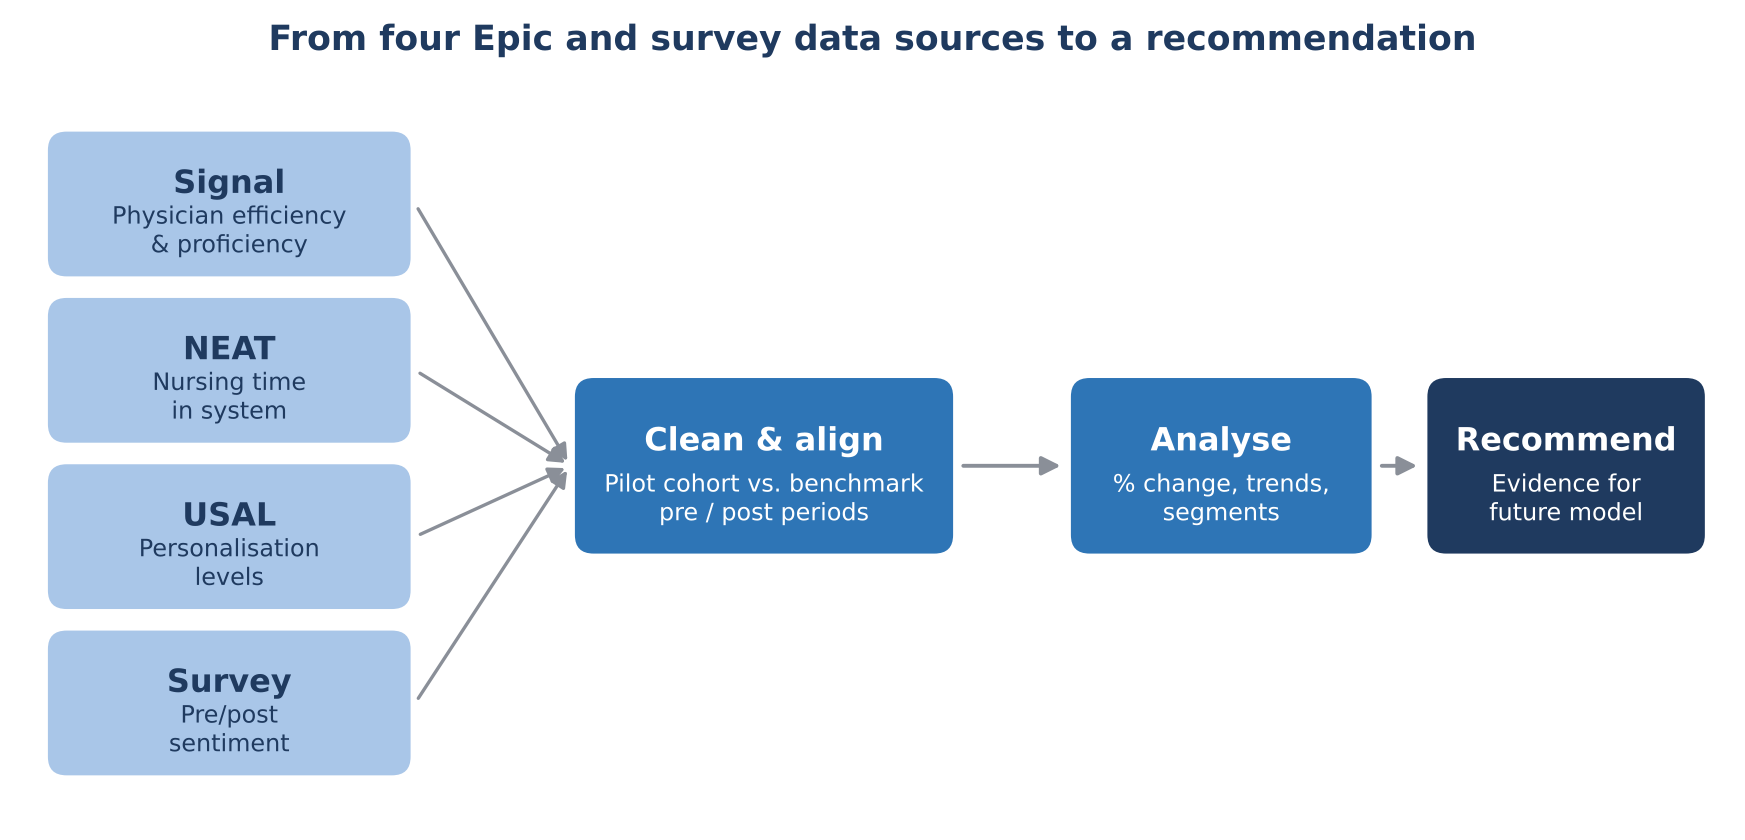
Figure 1. How I brought four data sources together into a single evaluation.
Key findings
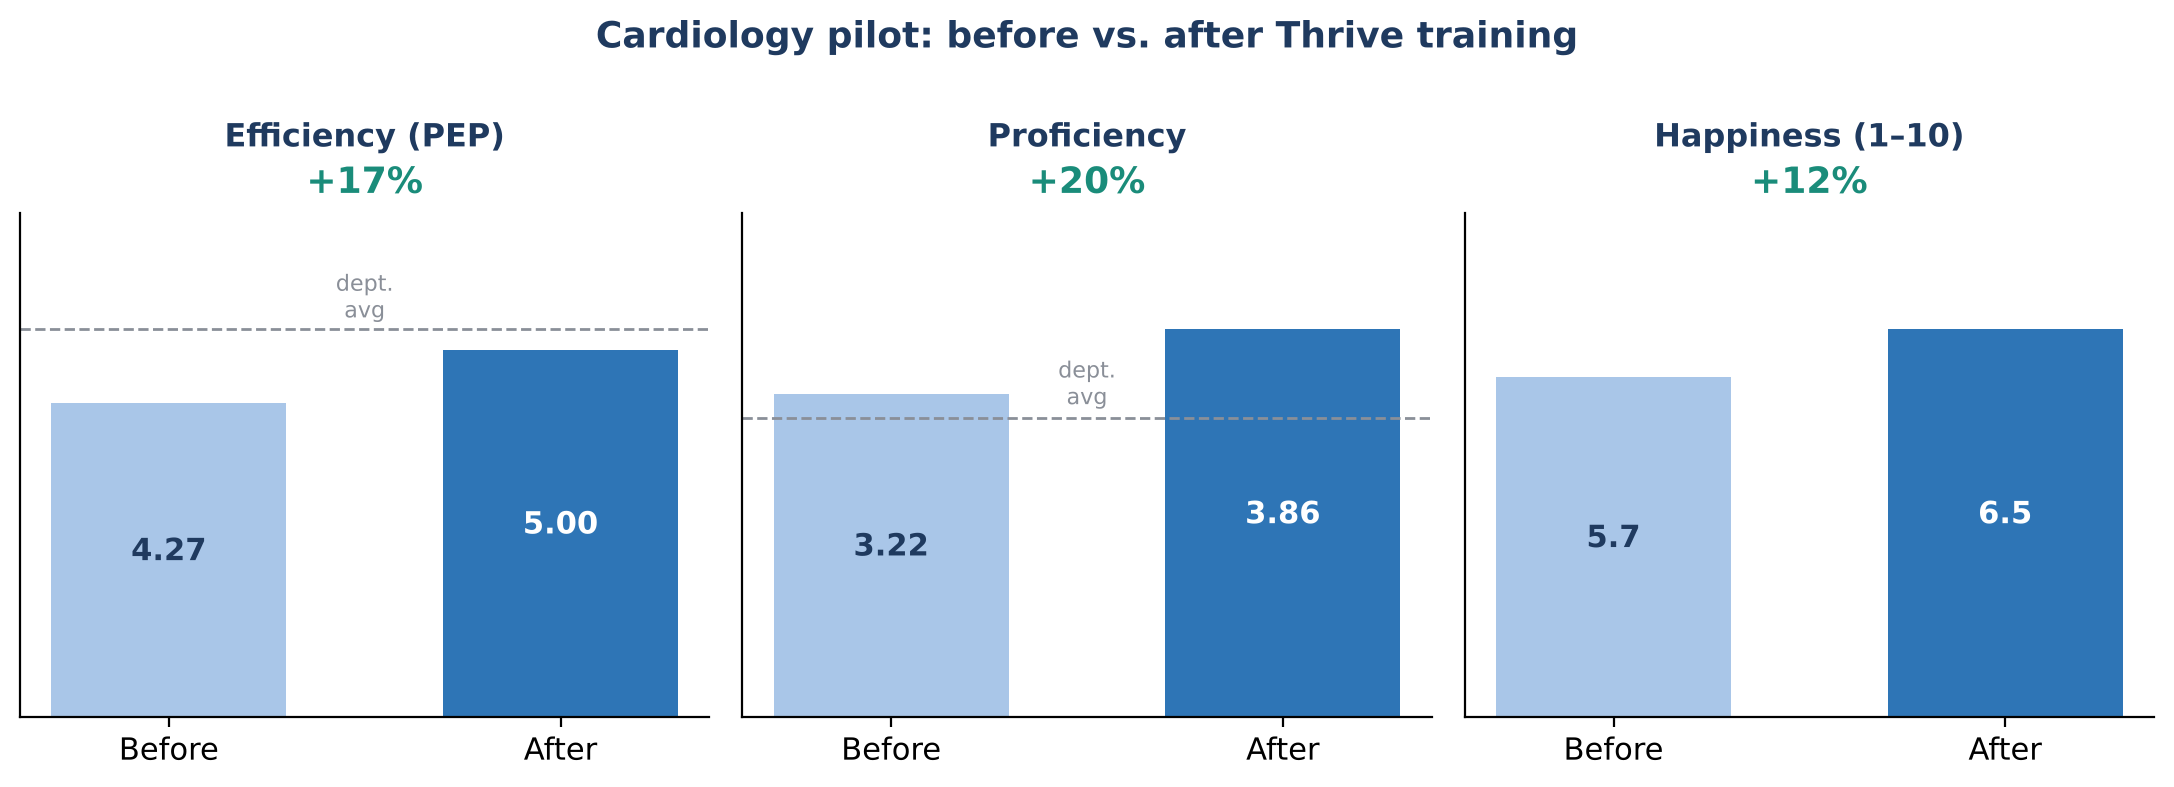
Figure 2. Cardiology pilot results. ‘Before’ values are derived from the reported percentage change; dashed line shows the GSTT Cardiology average.
-
Thrive works. Cardiology recorded +17% efficiency, +20% proficiency and +12% happiness (5.7 to 6.5).
-
Voice recognition matters. Dragon users reported higher happiness, but only a third of respondents used it and active users across the trust were declining. Set-up time was the main barrier.
-
Survey data was underused. It was instant and cheap compared with Epic extracts, which carried a significant delay and overhead.
-
Nursing and admin were blind spots. Epic offered very limited ways to track personalisation for these groups, despite them making up more than a third of users.
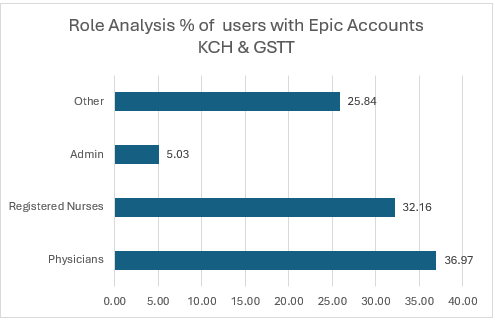
Figure 3. Epic users by role across the two trusts (w/e 23 Feb 2024): the population Thrive aims to reach.
Recommendations I made
-
Scale back intensive pilot-level monitoring and use the data instead to prioritise which services join the Thrive waiting list.
-
Make the pre/post survey a standard, low-cost measure of impact for every cohort.
-
Work with Epic’s Cogito reporting team to build custom reports from User Action Log (UAL) data, closing the gaps for nursing and admin staff.
-
Allocate ongoing analyst time to track productivity alongside personalisation levels, so future Thrive delivery is driven by evidence.
Skills demonstrated
Programme evaluation design · pre/post and benchmark analysis · EHR usage analytics (Epic Signal, NEAT, USAL) · survey design · data visualisation · translating analysis into recommendations for senior stakeholders · working with clinical teams across two NHS trusts
Figures are recreated from aggregate results in the programme proposal. No patient or individual-level data is shown.